Infographics – key to concise writing

When I taught high school English, I asked my students to write a full essay on a persuasive, current topic of their choice. We’d review it, critique it and edit it. Eventually, when they thought it was final, I’d ask them to transform it into an actual letter to the editor. They were required to choose a local paper of their choice, find the word count required, and cut their words to meet the requirement. They moaned. They groaned. They became concise writers.

When you are challenged to state your argument in fewer words or in another medium, you force your brain to think creatively and critically. You cannot afford to waste space on words without impact.

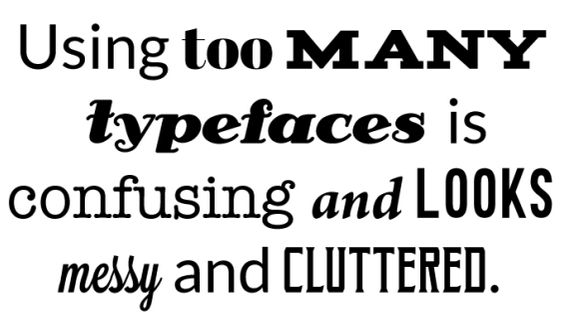
Infographics are a great way of setting up this challenge. An infographic must state an argument in words, pictures, and engaging design. When creating an infographic, you are challenged to meet your audience’s needs. This is not to say there is no purpose for a full essay. But, there is something to be said for writing in multimedia.

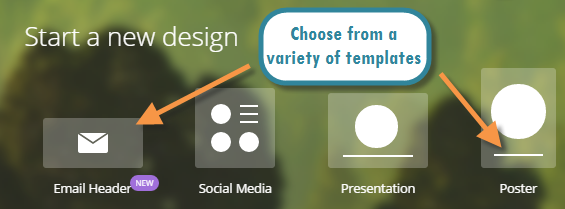
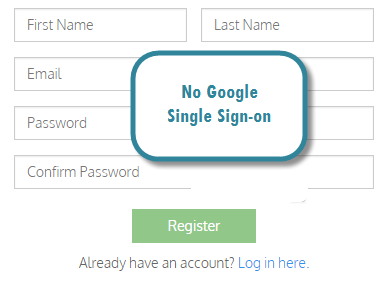
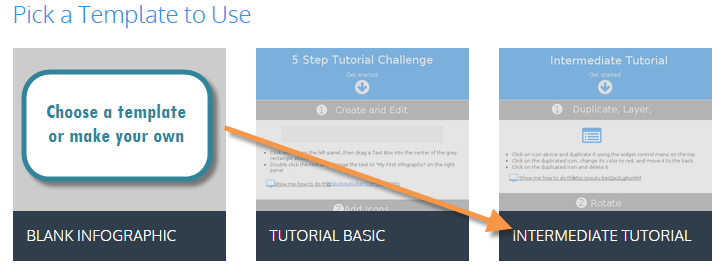
To show that point, I’ve transformed by Infographics presentation of my favorite resources into an infographic! I used Piktochart to create the infographic, but Canva to create many of the presentation slides.

Recently, I transformed a standard thesis writing assignment into an infographic. Students were challenged to write a simple thesis statement and support it with three pieces of evidence, with each piece of evidence written with contextual notes. Essentially, students wrote a small paper, but without the hype. As a teacher, I was able to dissect elements of their writing to offer better help going forward. Check out the assignment here.

Check out fennovation.org for more writing tips (fennovation.org soon to move under fennestudio.com). Enjoy!

Infographics rule!

I don’t know about you, but I’m a multitasker. And, as a multitasker, it is hard to retain information effectively. That’s why infographics are important – not only to read, but to create.

They are a short and effective way of conveying information. Our students are more apt to respond to and read. But, they should also create them. The art of creating infographics is the art of being concise. It’s the art of choosing your words with purpose. It’s the art of choosing images that matter.

To help you get started with infographics, I’ve compiled my favorite creation tools into one presentation. Though, admittedly, to get the point across, I should put them into an infographic!

Check out fennovation.org for more presentation tools to get you started. Enjoy!

Infographics – your resource guide!

Infographics are one of my favorite ways to get students to organize material. In the past, when students create presentations, they tend to go over the limit. They cut and paste, they don’t summarize, they don’t pull out the important details.

However, with infographics, they are forced to read, to summarize, the analyze information. Last year, my fellow librarians and I had students creating infographics over historical events surrounding the time frame of To Kill a Mockingbird. At first, students deleted the portions where they were to add images and replaced it with text. We had to teach, reteach, and reteach again about allowing images to speak in the place of text and about using trigger words. The students learned a lot more than just content. They learned important and essential skills.

I have highlighted some of my favorite infographic tools as well as some that function as presentation tools too in this presentation. You can read up more on infographic and presentation tools on fennovation.org.

Enjoy!

Get your #infographics on!

I love infographics. Though you could argue they are just another form of presentations (which they are), they also encourage concise writing, something my students always had difficulty doing.

Last year, I worked with our librarians and 9th grade students to great infographics related to issues in the time of To Kill a Mockingbird. Even though we gave students examples of infographics and repeated that the text must be concise and powerful, they still copied and pasted huge chunks of text. So, we had to do it again, and again, and again.

The point: this was clearly a skill students were missing. In the era of attention-getters and short text, it’s a critical skill.

So, I’m compile a presentation of infographics resources to meet the needs of students and teachers alike. See something I’m missing? Let me know, please!

You can check out more resources at fennovation.org.

#Infographics – the tools you need!

I just added a few new infographic resources to my Set Your Data Loose presentation. If you aren’t using infographics, you should. They offer everything a presentation you can do and then some. In fact, I could make an infographic on why you should try out infographics this year.

Updates include:

Check out Fennovation.org for more infographic resources!

More #infographic resources!

I love infographics. Who doesn’t?! However, with so many resources out there to create infographics, it’s hard to sift through them as a classroom teachers. So, I’ve started a running presentation of the infographic tools my teachers use and my students recommend. To find out more, check out this information on fennovation.org or the Set your data loose presentation.


  • Upload your own images
  • Download as an image file
  • Share via Google + and Twitter
  • Search from a gallery of icons and templates


  • Upload your own images
  • Download as an image file or PDF
  • Share with a link or embed code
  • Search from a gallery of vhemes, objects, shapes, and backgrounds


  • Add media
  • Share with a link, embed code, and Twitter
  • Edit and customize pre-existing items


  • Upload your own images
  • Download as an image or PDF
  • Share with a link or Twitter
  • Edit and customize pre-existing items with a huge gallery selection!


  • Upload your own images
  • Share via Google + or Twitter
  • Edit and customize pre-existing items with a huge gallery selection!
  • A large gallery of pictograms and graphs to integrate with data


  • Upload your own images
  • Download as an image or PDF
  • Share with Twitter
  • Build-your-own infographic set up
  • No pre-set templates


  • Upload your own resume
  • Download as an image or PDF
  • Share with a link, embed code, Google + or Twitter
  • Edit and customize pre-existing items with a huge gallery selection!
  • Partners with Venngage


  • Browse a variety of templates
  • Download as an image (PNG, JPEG) or PDF
  • Share with a link, embed code, Google + or Twitter
  • Collaborate with others simultaneously
  • Easily embed in other products (especially Google)


  • Contains many teaching materials and tutorials
  • Classroom teacher lessons & vetted
  • FREE!


  • 20 tips on how to avoid typography mistakes
  • FREE!
  • Easy to use & clear for student instruction


  • Contains over 20 graphic organizer templates
  • Make a copy & it is yours to edit and share!
  • FREE!


  • Share with a link, Google + or Twitter
  • Edit and customize pre-existing items with a huge gallery selection!
  • Presents in a presentation mode
  • Offers many premium features
  • Limited free features, but can upload existing presentations & edit
Stare emaze.gif


Set your data loose with infographics – classroom edition

I love infographics, but oftentimes, they are misused. When we try to change the standard “PowerPoint” presentation into an infographic, we miss the point of infographics. I’m a supporter of steering away from the standard “PowerPoint” presentation that throws all of the information onto the slide. This is especially true for students. 

As a former high school English teacher, I have been subject to many regurgitated presentations; presentations that are so text and information-heavy that students get lost in their words. That’s where infographics come in – they should be short and sweet. They should challenge students to get to the point. That’s not only a hard thing for students, but a challenging one for professionals. 
The tools below are excellent platforms for the creation of infographics. However, without instruction of the point of infographics, they too can miss their meaning and become text and information-heavy. 
So, do it – challenge your peers, your students, and yourself to get to the point and share infographics. 

  • Upload your own images
  • Download as an image file
  • Share via Google + and Twitter
  • Search from a gallery of icons and templates

  • Upload your own images
  • Download as an image file or PDF
  • Share with a link or embed code
  • Search from a gallery of vhemes, objects, shapes, and backgrounds

  • Add media
  • Share with a link, embed code, and Twitter
  • Edit and customize pre-existing items

  • Upload your own images
  • Download as an image or PDF
  • Share with a link or Twitter
  • Edit and customize pre-existing items with a huge gallery selection!

  • Upload your own images
  • Share via Google + or Twitter
  • Edit and customize pre-existing items with a huge gallery selection!
  • A large gallery of pictograms and graphs to integrate with data

  • Upload your own images
  • Download as an image or PDF
  • Share with Twitter
  • Build-your-own infographic set up
  • No pre-set templates

  • Upload your own resume
  • Download as an image or PDF
  • Share with a link, embed code, Google + or Twitter
  • Edit and customize pre-existing items with a huge gallery selection!
  • Partners with Venngage

  • Browse a variety of templates
  • Download as an image (PNG, JPEG) or PDF
  • Share with a link, embed code, Google + or Twitter
  • Collaborate with others simultaneously
  • Easily embed in other products (especially Google)

  • Contains many teaching materials and tutorials
  • Classroom teacher lessons & vetted
  • FREE!
  • 20 tips on how to avoid typography mistakes
  • FREE!
  • Easy to use & clear for student instruction

For more fun tools & integration/innovation tips, check out Fennovation.org